The STB is required by law to publish the RCAF on at least a quarterly basis. The Association of American Railroads (AAR) each quarter computes three types of RCAF figures and submits them for STB approval:
- Unadjusted RCAF: “an index reflecting cost changes experienced by the railroad industry, without reference to changes in rail productivity.”
- Adjusted RCAF: “an index that reflects national average productivity changes as originally developed and applied by the ICC [Interstate Commerce Commission; the STB’s predecessor], the calculation of which is currently based on a five-year moving average.” According to the STB, the five-year moving geometric average of productivity change for U.S. Class I railroads from 2019-2023 is 1.014 (1.4% per year).
- RCAF-5: “an index that also reflects national average productivity changes; however, those productivity changes are calculated as if a five-year moving average had been applied consistently from the productivity adjustment’s inception in 1989.” The RCAF-5 for second-quarter 2026 uses a productivity trend for the years 2019-2023, which is 1.014 (1.4% per year), according to the STB.
The STB, in its March 19 decision (scroll down to download), reported that it has reviewed AAR’s submission and adopted the RCAF figures for second-quarter 2026: unadjusted RCAF, 1.016 (up 0.1% from first-quarter 2026’s 1.015); adjusted RCAF, 0.388 (down 0.3% from first-quarter 2026’s 0.389); and RCAF-5, 0.368 (down 0.3% from first-quarter 2026’s 0.369).
Table A shows the index of railroad input prices, unadjusted RCAF, adjusted RCAF, and RCAF-5 for second-quarter 2026 and first-quarter 2026:
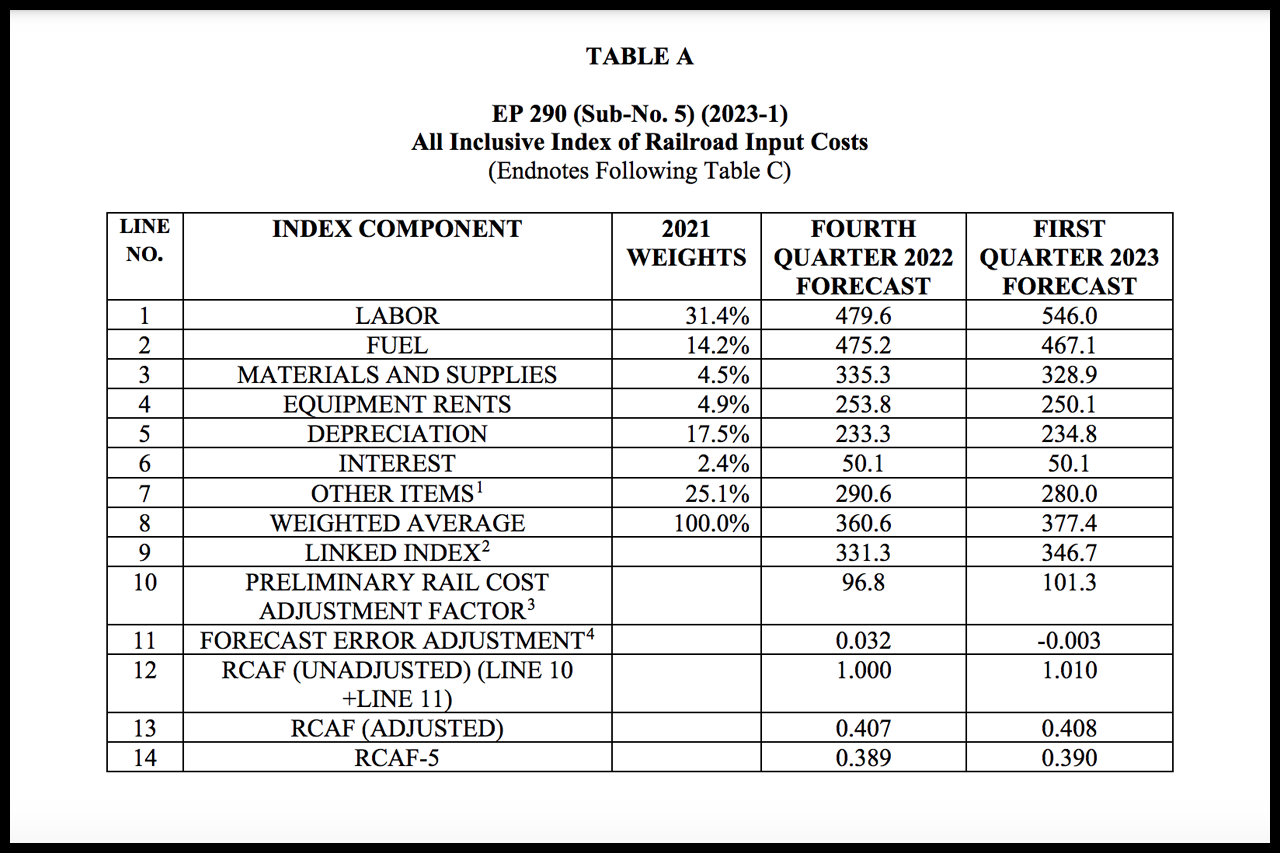
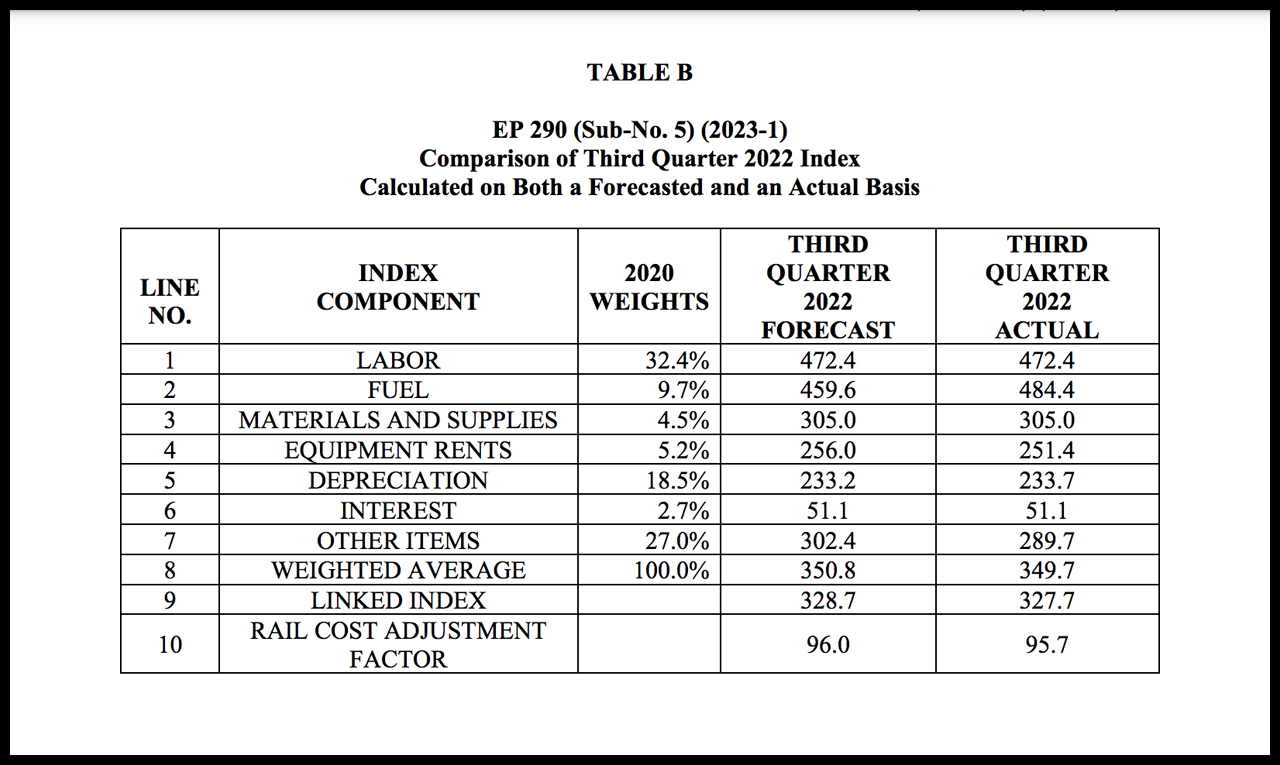
Table B shows the fourth-quarter 2025 index and the RCAF calculated on both an actual and forecasted basis (the difference between the actual calculation and the forecasted calculation is the forecast error adjustment):