U.S. Rail Traffic: ‘Reasons for Both Optimism and Caution’

“[W]e are cautious to put too much stock in this month’s exact results,” Gray stressed, since July rail volumes are always impacted by July 4 closures, “but there are reasons for both optimism and caution.”
In July 2023, nine of the 20 carload commodity categories tracked by AAR (Association of American Railroads) each month saw carload gains compared with July 2022. These included motor vehicles and parts, up 6,437 carloads or 13.1%; crushed stone, sand and gravel, up 6,079 carloads or 7.5%; and primary metal products, up 2,935 carloads or 10.3%. Commodities that saw declines included grain, down 15,585 carloads or 21.0%; coal, down 5,709 carloads or 2.2%; and pulp and paper products, down 1,631 carloads or 9.1%.
“As the economy goes so goes rail traffic, and we’re seeing that with the mixed results across volumes being impacted by larger varying market conditions,” Gray pointed out.
U.S. Class I railroads hauled 875,660 carloads last month, down 0.6%, or 5,599 carloads, from July 2022; and 967,553 containers and trailers, down 5.5%, or 56,737 units. Combined U.S. carload and intermodal originations in July 2023 came in at 1,843,213, down 3.3%, or 62,336 carloads and intermodal units from the same month last year.
Excluding coal, carloads were up 110 carloads, or 0.0%, in July 2023 from July 2022. Excluding coal and grain, carloads were up 15,695 carloads, or 2.9%.

How does July 2023 compare with the same month in 2022, 2021, 2020 and 2019? Let’s look back:
• “Rail traffic in July [2022] was evenly balanced between commodities with carload gains and those with carload declines,” John T. Gray reported Aug. 3, 2022. “As such, it does not provide definitive evidence regarding the state of the overall economy. In that respect, it is very similar to most other recent economic indicators.” In July 2022, 10 of the 20 carload commodity categories tracked by the AAR saw carload gains compared with July 2021. These included coal, up 5,588 carloads or 2.2%; crushed stone, sand and gravel, up 5,197 carloads or 6.7%; and motor vehicles and parts, up 3,726 carloads or 8.2%. Commodities that saw declines included primary metal products, down 7,065 carloads or 19.2%; all other carloads, down 3,311 carloads or 15.1%; and stone, clay and glass products, down 2,202 carloads or 6.7%. U.S. Class I railroads originated 906,903 carloads in July 2022, up 0.2%, or 2,213 carloads, from July 2021; and 1,033,906 containers and trailers, down 3%, or 32,094 units. Combined U.S. carload and intermodal originations in July 2022 was 1,940,809, down 1.5%, or 29,881 carloads and intermodal units from July 2021.
• While U.S. rail traffic in July 2021 was up from July 2020, the percentage increase was “significantly lower” than in other recent months, Gray reported Aug. 4, 2021. Gray said this was due to “more difficult comparisons and because various external factors have led to a recent deceleration in rail volumes.” He provided examples: “Grain exports are down sharply, taking rail carloads of grain down with them”; “[a]utomakers are still hampered by semiconductor shortages, leading to sharply lower rail auto volumes; and “[w]orldwide supply chain slowdowns are impacting both rail customers and railroads themselves.” Gray explained that “[w]hile all of these should be manageable, temporary setbacks, their convergence has resulted in weaker rail volumes than basic domestic economic factors might otherwise imply.” In July 2021, U.S. Class I railroads originated 904,670 carloads, rising 6.6%, or 55,969 carloads, from July 2020, and they originated 1,066,169 containers and trailers, increasing 1.5%, or 15,450 units. Combined, July 2021’s originations came in at 1,970,839, up 3.8%, or 71,419 carloads and intermodal units from July 2020.
• “The old saying, ‘You have to play the hand you’re dealt’ applies to railroads,” said Gray on Aug. 5, 2020. “Rail traffic, like the overall economy, is generally trending in the right direction, but progress is slow; there’s a long way to go before it’s back to normal; and both week-to-week improvements and setbacks in individual commodities are to be expected. Coal and other energy-related rail commodities continue to struggle more than most, while intermodal is closer than any other rail traffic category to pre-pandemic levels.” U.S. railroads originated 1,042,017 carloads in July 2020, down 17.6%, or 222,337 carloads, from July 2019. U.S. railroads also originated 1,295,960 containers and trailers in July 2020, down 1.4%, or 18,403 units, from the same month in 2019. Combined U.S. carload and intermodal originations in July 2020 were 2,337,977, down 9.3%, or 240,740 carloads and intermodal units from July 2019.
• “Rail traffic in July [2019], as in many other recent months, was held back by declines in three of the largest rail traffic segments: coal, grain and intermodal,” Gray reported Aug. 7, 2019. “Despite a summer heat wave of historical proportions, very low prices for natural gas have seriously weakened the seasonal demand for coal-generated electrical power. These same low natural gas prices appear to have allowed chemical production to pretty much hold steady even in the face of the uncertainty around foreign trade, which has been the source of much of the recent growth in chemical production. With 50% of rail intermodal business overseas—including international trade, both imports of consumer and intermediate manufacturing components and exports such as food products—trade policy uncertainty continues to drag down this traffic segment. Export grain movements are also facing increasingly serious headwinds from threats to trade policy stability.” U.S. railroads originated 1,264,100 carloads in July 2019, down 4.8%, or 64,406 carloads, from July 2018. U.S. railroads also originated 1,314,333 containers and trailers in July 2019, down 6.1%, or 84,878 units, from the same month in 2018. Combined U.S. carload and intermodal originations in July 2019 were 2,578,433, down 5.5%, or 149,284 carloads and intermodal units from July 2018.
Year to Date 2023
Total U.S. carload traffic for the first seven months of 2023 was 6,719,395 carloads, up 0.4%, or 26,948 carloads, from the same period last year; and 7,081,148 intermodal units, down 9.6%, or 755,112 containers and trailers, from last year, according to AAR.
Total combined U.S. traffic for the first 30 weeks of this year came in at 13,800,543 carloads and intermodal units, a 5.0% fall-off from the same point in 2022.
Week Ending July 29, 2023
Total U.S. rail traffic was 483,481 carloads and intermodal units for the week ending July 29, 2023, down 2.6% from the prior-year period.
Total carloads for the week ending July 29, 2023, were 230,511 carloads, flat with the same week in 2022, while U.S. weekly intermodal volume was 252,970 containers and trailers, down 4.8% compared with last year.
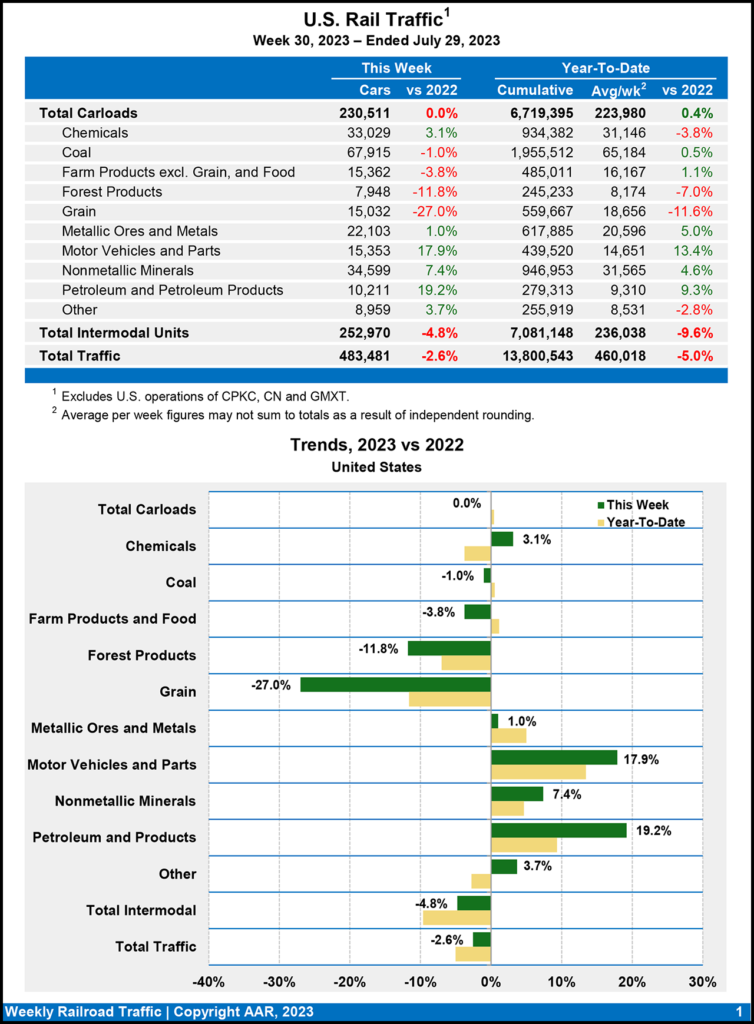
Six of the 10 carload commodity groups posted an increase vs. the same week in 2022. They included nonmetallic minerals, up 2,381 carloads, to 34,599; motor vehicles and parts, up 2,331 carloads, to 15,353; and petroleum and petroleum products, up 1,644 carloads, to 10,211. Commodity groups that posted declines included grain, down 5,557 carloads, to 15,032; forest products, down 1,061 carloads, to 7,948; and coal, down 710 carloads, to 67,915.
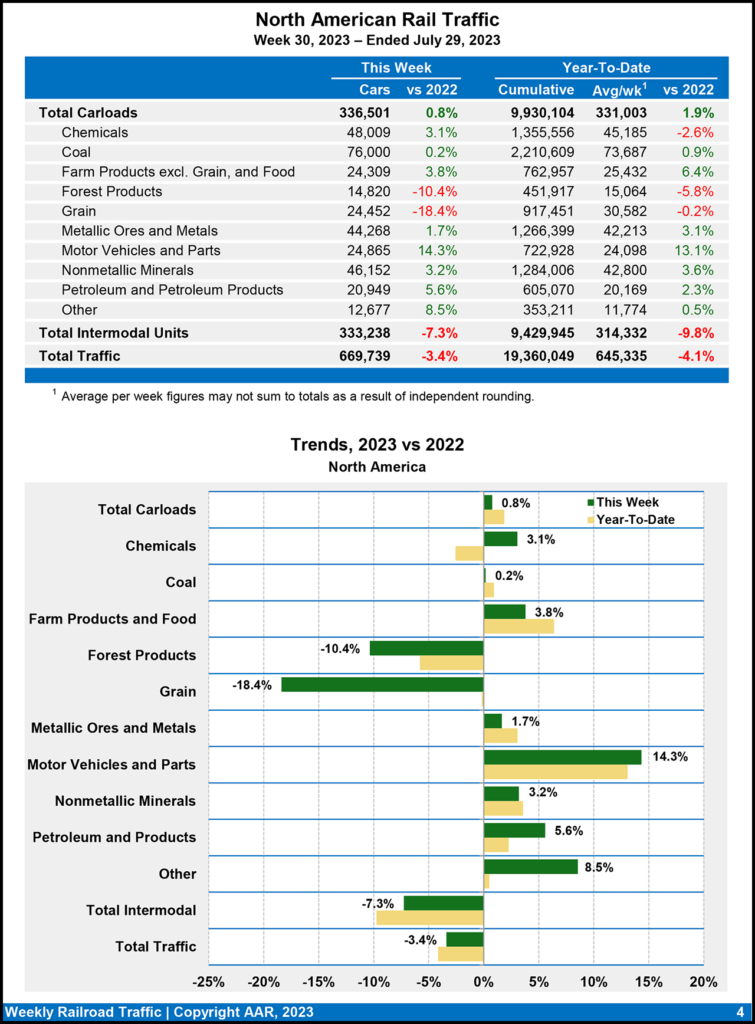
North American rail volume for the week ending July 29, 2023, on 10 reporting U.S., Canadian and Mexican railroads totaled 336,501 carloads, up 0.8% from the same point last year, and 333,238 intermodal units, down 7.3% from last year. Total combined weekly rail traffic in North America was 669,739 carloads and intermodal units, falling 3.4%. North American rail volume for the first 30 weeks of 2023 was 19,360,049 carloads and intermodal units, decreasing 4.1% compared with 2022.
Canadian railroads reported 88,057 carloads for the week ending July 29, 2023, increasing 3.0%, and 68,604 intermodal units, dropping 15.9% vs. the same week last year. For the first 30 weeks of 2023, they reported cumulative rail traffic volume of 4,723,996 carloads, containers and trailers, dipping 2.8%.
Mexican railroads reported 17,933 carloads for the week ending July 29, 2023, up 0.5% from the prior-year period, and 11,664 intermodal units, down 3.6%. Their cumulative volume for the first 30 weeks of this year was 835,510 carloads and intermodal containers and trailers, up 3.5% from 2022.